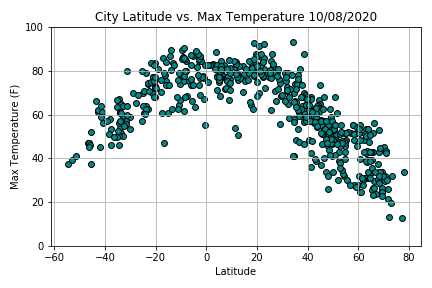
Temperature
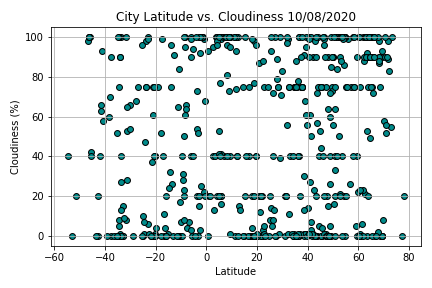
Cloudiness
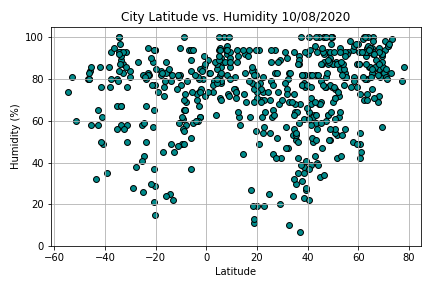
Humidity
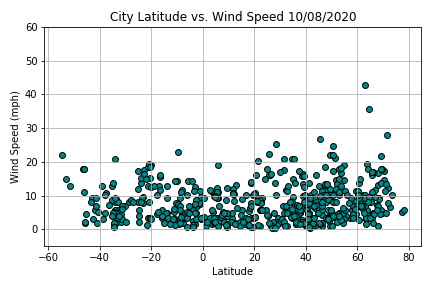
4 variables and more than 500 cities analyzed.
After assembling the dataset, we used Matplotlib to plot various aspects of the weather of vs latitude. Factores we looked at included: temperature, cloudiness, wind speed, and humidity. This site provides the source data and visualizations created as part of the analysis, as well as explanations and descriptions of any trends and correlations witnessed.