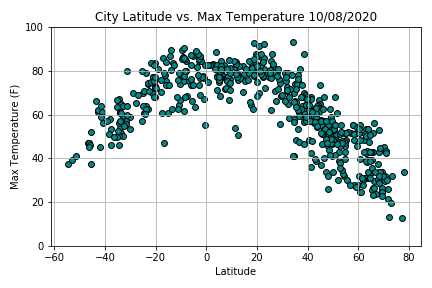
According to the chart, it is possible to establish a relationship between the temperature and the latitude. The different points of the information are clot, which allows visualizing a trend. The weather gets warmer as one approaches the equator (0 Deg. Latitude).
Temperature
Visualizations